-- GillesDuvert - 16 May 2012
aspro is able to plot almost anything versus anything else (see plottables.png at end of page), with error bars, but for 1 source, and ignoring spectral bands. One can plot individual points or mean,rms,min,max,median of a series of values. Histograms and theoretical functions, although desirable, are not provided. ASPRO uses a 'flat' decomposition of the structured OI-FITS (all the data have the same dimensions, even if it makes for a lot of redundancy and memory size, it is very efficient).
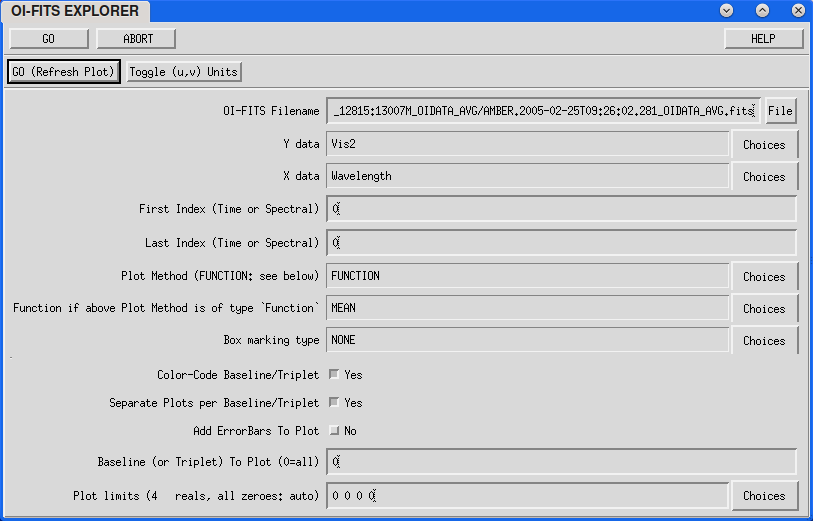
- simpleExplorerMenu.png:
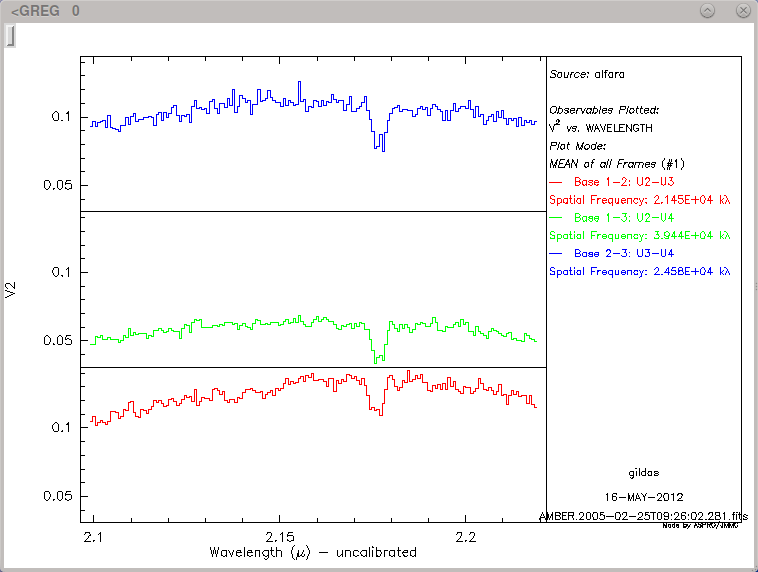
- v2versusWavelength3bases.png:
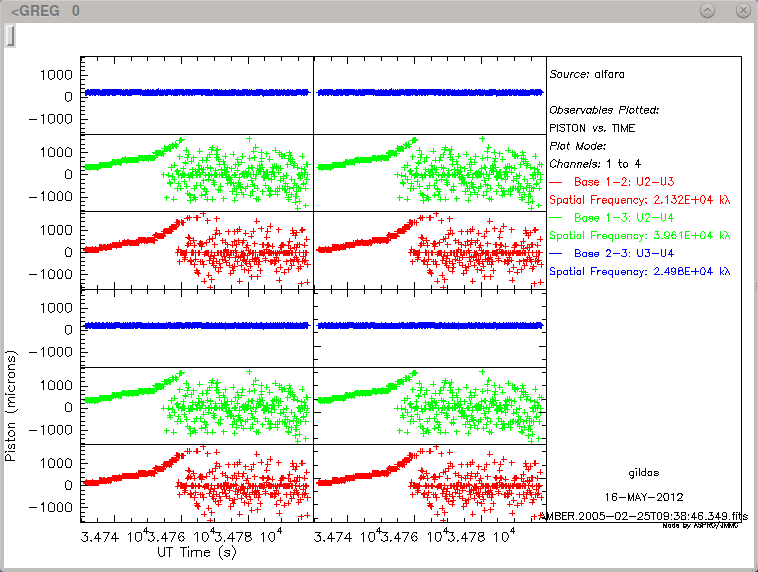
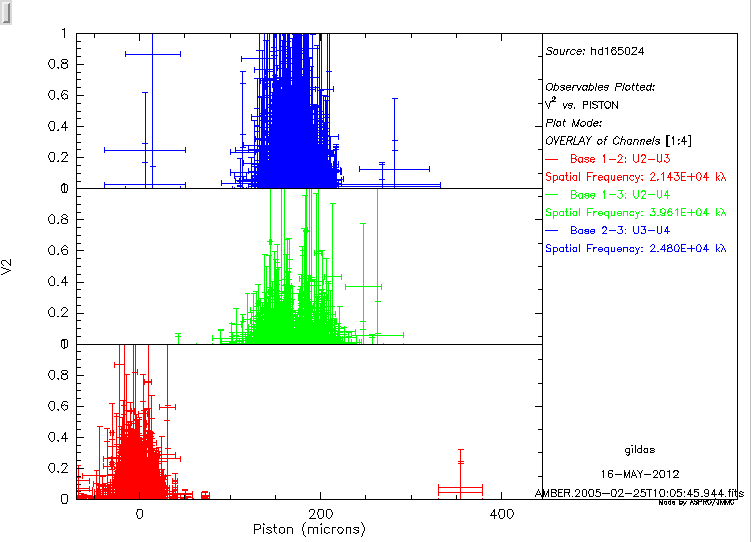
- v2vspiston.png:
- x.png:
- y.png:
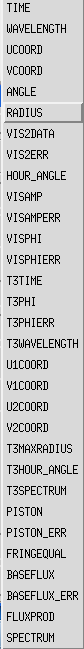
- plottables.png:


| I | Attachment | History | Action | Size | Date | Who | Comment |
|---|---|---|---|---|---|---|---|
| |
pistonversustime3bases4channels.png | r1 | manage | 28.4 K | 2012-05-16 - 11:36 | GillesDuvert | |
| |
plottables.png | r1 | manage | 3.8 K | 2012-05-16 - 11:40 | GillesDuvert | |
| |
simpleExplorerMenu.png | r1 | manage | 16.8 K | 2012-05-16 - 10:25 | GillesDuvert | |
| |
v2versusWavelength3bases.png | r1 | manage | 15.3 K | 2012-05-16 - 10:26 | GillesDuvert | |
| |
v2vspiston.png | r1 | manage | 14.0 K | 2012-05-16 - 11:54 | GillesDuvert | |
| |
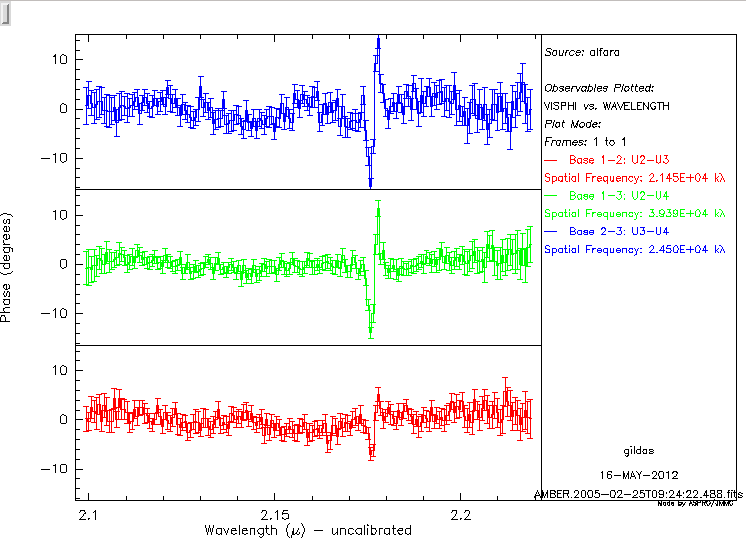
visphipluserrors.png | r1 | manage | 16.2 K | 2012-05-16 - 11:53 | GillesDuvert | |
| |
x.png | r1 | manage | 1.1 K | 2012-05-16 - 11:38 | GillesDuvert | |
| |
y.png | r1 | manage | 1.2 K | 2012-05-16 - 11:38 | GillesDuvert |
Topic revision: r2 - 2012-05-16 - GillesDuvert

Ideas, requests, problems regarding TWiki? Send feedback